
Data Analyst Interview Preparation: SQL, Excel, Power BI, Statistics and Case Questions
Prepare for analyst interviews with the question types that appear most often, model answers and practice links: SQL coding rounds (joins, aggregation, window functions), Excel and Power BI questions, statistics and A/B testing, metric and product-sense cases, and behavioural questions with the STAR method.
- Solve common SQL interview patterns quickly and explain your approach
- Answer core Excel, Power BI and DAX questions
- Explain key statistics and A/B testing concepts clearly
- Structure metric, root-cause and product-sense cases
- Tell project stories with STAR
The interview loop

SQL patterns you must know
import duckdb, pandas as pd
sales = pd.read_csv("superstore_sales.csv", parse_dates=["order_date"])
print(duckdb.sql("""
-- Top 2 products by sales in each region (window function)
WITH r AS (
  SELECT region, product_name, SUM(sales) AS sales,
         RANK() OVER (PARTITION BY region ORDER BY SUM(sales) DESC) AS rnk
  FROM sales GROUP BY region, product_name)
SELECT region, product_name, ROUND(sales) AS sales FROM r WHERE rnk <= 2 ORDER BY region, rnk;
""").df())region product_name sales 0 East Apex Copier 347 4191180.0 1 East Zenith Copier 719 3323372.0 2 North Orbit Copier 746 3790940.0 3 North Zenith Machine 401 3566453.0 4 South Orbit Copier 746 5405517.0 5 South Vertex Copier 262 4258600.0 6 West Zenith Copier 719 4087068.0 7 West Zenith Machine 401 4023468.0
import duckdb, pandas as pd
sales = pd.read_csv("superstore_sales.csv", parse_dates=["order_date"])
print(duckdb.sql("""
-- Month-over-month growth with LAG
WITH m AS (SELECT DATE_TRUNC('month', order_date) AS month, SUM(sales) AS sales FROM sales GROUP BY 1)
SELECT month, ROUND(sales) AS sales, ROUND(100.0 * (sales - LAG(sales) OVER (ORDER BY month)) / LAG(sales) OVER (ORDER BY month), 1) AS mom_pct
FROM m ORDER BY month DESC LIMIT 4;
""").df())month sales mom_pct 0 2025-12-01 7652267.0 -25.6 1 2025-11-01 10284516.0 67.5 2 2025-10-01 6140290.0 -27.5 3 2025-09-01 8468060.0 45.9
| Pattern | Typical question |
|---|---|
| GROUP BY + HAVING | Customers with more than 5 orders |
| Joins (inner, left, anti) | Customers who never ordered |
| Window: ROW_NUMBER/RANK | Top N per group, de-duplicate latest record |
| Window: LAG/LEAD, running SUM | Growth, retention, cumulative totals |
| CASE WHEN | Buckets, conditional counts, pivots |
| Date functions | Monthly cohorts, days between events |
| Self join / recursive CTE | Manager hierarchy, consecutive days |
Approach out loud: clarify the table grain → write the query step by step (CTEs) → check edge cases (NULLs, ties, duplicates) → validate with a small count.
Excel and Power BI questions
| Question | Short answer |
|---|---|
| VLOOKUP vs XLOOKUP vs INDEX-MATCH? | XLOOKUP looks left/right, has defaults and exact match by default; INDEX-MATCH works in older versions; VLOOKUP breaks when columns move |
| Pivot table vs Power Pivot? | Power Pivot uses a data model with relationships and DAX measures across tables |
| Calculated column vs measure (DAX)? | Columns are computed row by row and stored; measures are evaluated in filter context at query time |
| What does CALCULATE do? | Evaluates an expression in a modified filter context |
| Star schema? | Fact table of events joined to dimension tables; simpler, faster models |
| Import vs DirectQuery? | Import copies data (fast, scheduled refresh); DirectQuery queries the source live (fresh, slower) |
| Row-level security? | Roles with DAX filters so users see only their rows |
Statistics and experiments
Be ready to explain: mean vs median, standard deviation, distributions, correlation vs causation, confidence intervals, p-values, Type I/II errors, sample size and A/B test pitfalls (peeking, SRM, novelty). See ML lessons 1–6 for model answers.
Case questions: a framework
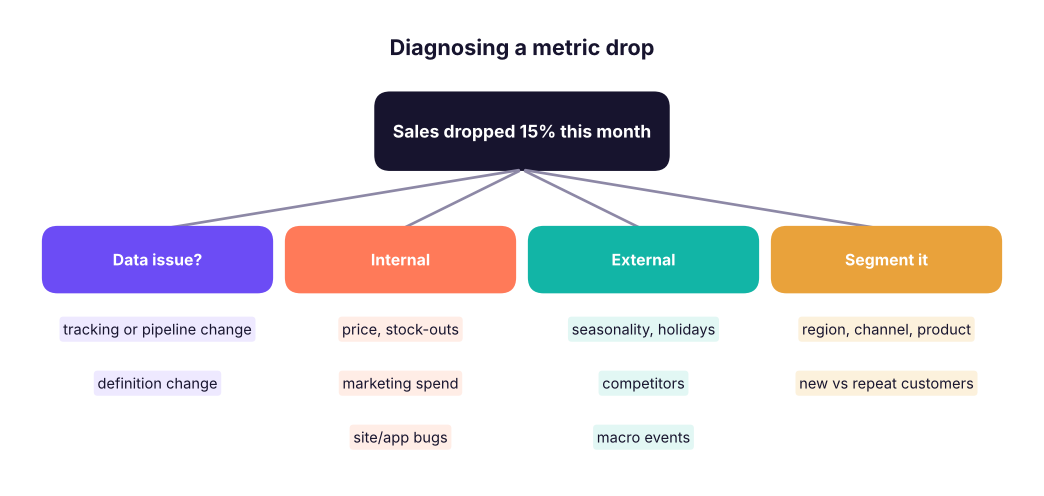
- Clarify the metric and time frame. 2. Check data quality first. 3. Segment (where is the drop?). 4. Form hypotheses (internal vs external). 5. Validate with data. 6. Recommend action and how you would measure it.
Product-sense metrics: define a north-star metric, input metrics and guardrails (e.g. for a food-delivery app: weekly ordering customers; conversion, delivery time, order value; cancellations, complaints).
Behavioural: STAR
Situation (context) → Task (your goal) → Action (what you did, with tools) → Result (numbers, learning). Prepare 6 stories: a project you are proud of, a mistake you fixed, a conflict, a tight deadline, influencing without authority, learning a new tool fast.
Practice resources
W3Schools SQL quiz and exercises, LeetCode SQL 50, HackerRank SQL, StrataScratch, DataLemur, Kaggle Learn; mock interviews with peers; time yourself (15 minutes per medium SQL question).
- Master SQL patterns: aggregation, joins, window functions, CTEs, dates; think aloud and check edge cases.
- Know Excel lookups/pivots and Power BI modelling, DAX, CALCULATE, star schema and RLS.
- Explain statistics and A/B testing simply.
- Use a structured framework for metric and product cases.
- Prepare STAR stories with quantified results.
1. Which SQL feature finds the top 3 products in each category?
2. Sales dropped 15%. What is the first check?
3. What is a DAX measure?
4. What does STAR stand for?
(1) Write SQL for: customers who ordered in 2024 but not in 2025; the second-highest order per customer; 7-day moving average of sales. (2) Prepare two STAR stories. (3) Do a 30-minute mock case: "Delivery complaints doubled last week."
Show solution
Use NOT EXISTS / LEFT JOIN ... IS NULL for the anti-join, DENSE_RANK() = 2 for the second highest, and AVG(...) OVER (ORDER BY day ROWS BETWEEN 6 PRECEDING AND CURRENT ROW) for the moving average.
Practise more online
Free, trusted places to test yourself on this topic. Links open the original site in a new tab.