
Clustering I: K-Means and RFM Customer Segmentation
Find groups without labels. Heuristic RFM segmentation (recency, frequency, monetary scores and named segments) as taught in class, then K-means clustering, scaling and log transforms, choosing k with the elbow method and silhouette score, profiling and naming clusters, and turning segments into marketing actions, on 4,500 retail transactions.
- Compute recency, frequency and monetary value per customer from transactions
- Build heuristic RFM scores and named segments (Champions, At risk, Hibernating…)
- Run K-means, explain its algorithm and its assumptions, and scale features properly
- Choose k with the elbow method and silhouette scores, and profile the clusters
- Translate segments into actions and measure them
Why segment customers?
Treating every customer the same wastes money: loyal customers get discounts they did not need, while slipping customers get nothing. Segmentation groups similar customers so each group gets the right message.
Step 1: RFM table
Recency: days since the last purchase (lower is better). Frequency: number of purchases. Monetary: total spend.
import pandas as pd, numpy as np
pd.set_option("display.max_columns", 20); pd.set_option("display.width", 160)
tx = pd.read_csv("retail_transactions.csv", parse_dates=["invoice_date"])
print(tx.shape, tx.customer_id.nunique(), "customers |", tx.invoice_date.min().date(), "to", tx.invoice_date.max().date())
snapshot = tx.invoice_date.max() + pd.Timedelta(days=1)
rfm = tx.groupby("customer_id").agg(recency=("invoice_date", lambda d: (snapshot - d.max()).days), frequency=("invoice_no", "nunique"), monetary=("amount", "sum"))
rfm["monetary"] = rfm.monetary.round(0)
print(rfm.describe().round(1).T[["mean", "50%", "min", "max"]])
print(rfm.head())(4548, 4) 500 customers | 2024-01-01 to 2025-12-22
mean 50% min max
recency 217.0 144.0 1.0 722.0
frequency 9.1 6.0 1.0 39.0
monetary 11058.9 5122.0 196.0 76170.0
recency frequency monetary
customer_id
R0001 53 33 54906.0
R0002 224 7 5426.0
R0003 26 33 56031.0
R0004 320 3 2017.0
R0005 109 35 49225.0Step 2: heuristic RFM scores
Score each dimension 1–5 by quintile (5 = best), then combine.
rfm["R"] = pd.qcut(rfm.recency, 5, labels=[5, 4, 3, 2, 1]).astype(int)            # recent = high score
rfm["F"] = pd.qcut(rfm.frequency.rank(method="first"), 5, labels=[1, 2, 3, 4, 5]).astype(int)
rfm["M"] = pd.qcut(rfm.monetary, 5, labels=[1, 2, 3, 4, 5]).astype(int)
rfm["RFM_code"] = rfm.R.astype(str) + rfm.F.astype(str) + rfm.M.astype(str)
rfm["RFM_score"] = rfm[["R", "F", "M"]].sum(axis=1)
def segment(r):
    if r.R >= 4 and r.F >= 4: return "Champions"
    if r.R >= 3 and r.F >= 3: return "Loyal"
    if r.R >= 4 and r.F <= 2: return "New / promising"
    if r.R <= 2 and r.F >= 4: return "At risk (were loyal)"
    if r.R <= 2 and r.F <= 2: return "Hibernating / lost"
    return "Need attention"
rfm["segment"] = rfm.apply(segment, axis=1)
seg = rfm.groupby("segment").agg(customers=("R", "size"), recency=("recency", "median"), frequency=("frequency", "median"), monetary=("monetary", "median"), revenue=("monetary", "sum"))
seg["revenue_%"] = (100 * seg.revenue / seg.revenue.sum()).round(1)
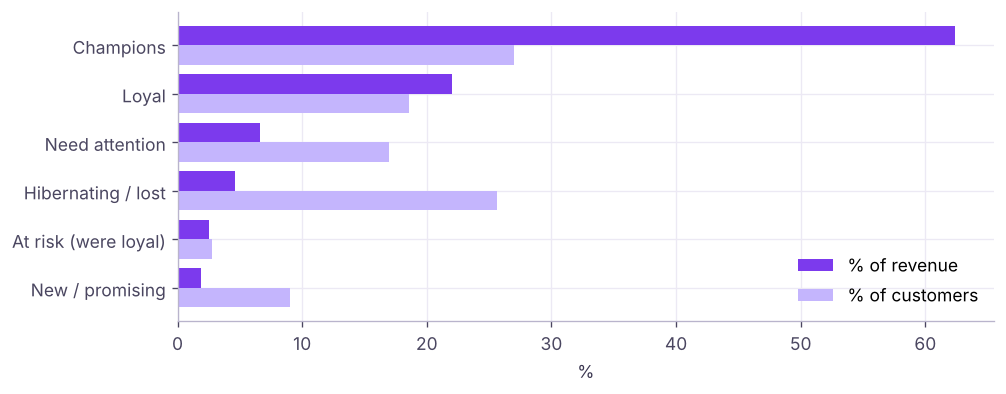
print(seg.sort_values("revenue", ascending=False).drop(columns="revenue"))customers recency frequency monetary revenue_% segment Champions 135 69.0 13.0 18414.0 62.4 Loyal 93 135.0 9.0 7844.0 22.0 Need attention 85 279.0 5.0 4236.0 6.6 Hibernating / lost 128 414.5 2.0 1836.5 4.6 At risk (were loyal) 14 235.5 9.0 7797.0 2.5 New / promising 45 80.0 3.0 2521.0 1.9
| Segment | Typical action |
|---|---|
| Champions | Reward, early access, referrals; do not over-discount |
| Loyal | Upsell, loyalty points |
| New / promising | Onboarding, second-purchase offer |
| At risk (were loyal) | Win-back call or personalised offer now |
| Hibernating / lost | Low-cost reactivation; accept some loss |
| Need attention | Targeted reminders |
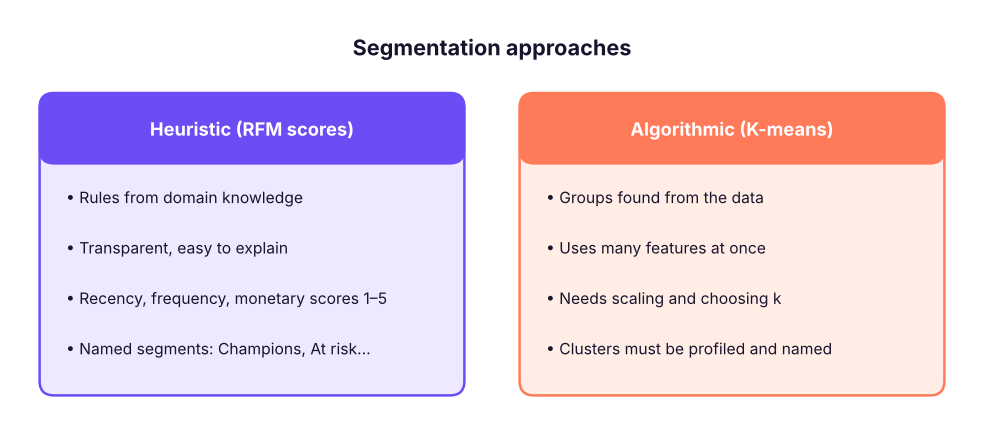
RFM is transparent and works well, which is why the live class starts there. Its limits: fixed rules, only three variables, and quintile cut-offs that may not match natural groups.
Step 3: K-means clustering
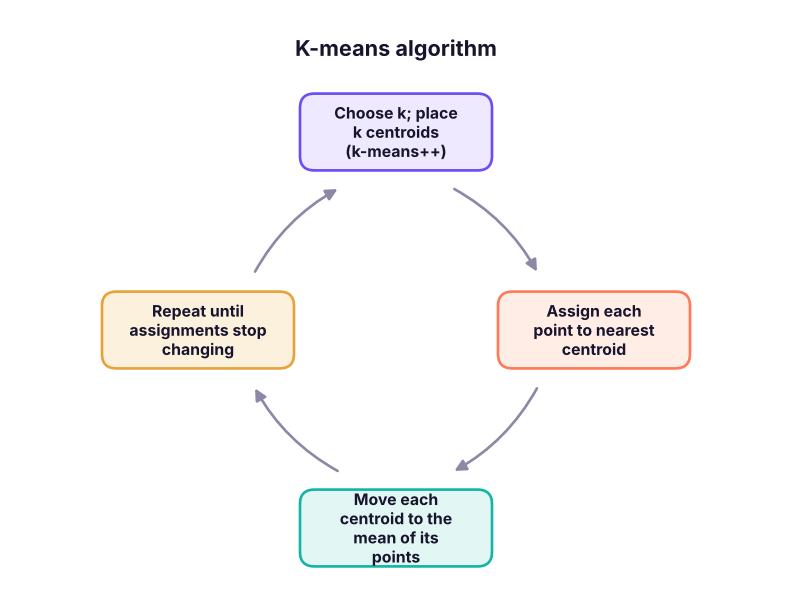
K-means partitions data into k clusters so that each point belongs to the cluster with the nearest centroid (mean), minimising the within-cluster sum of squares (inertia).
Prepare features: log and scale
from sklearn.preprocessing import StandardScaler
from sklearn.cluster import KMeans
feat = pd.DataFrame({"log_recency": np.log1p(rfm.recency), "log_frequency": np.log1p(rfm.frequency), "log_monetary": np.log1p(rfm.monetary)})
print("skew before log:", rfm[["recency", "frequency", "monetary"]].skew().round(2).to_dict(), "| after:", feat.skew().round(2).to_dict())
Z = StandardScaler().fit_transform(feat)skew before log: {'recency': 1.01, 'frequency': 1.73, 'monetary': 2.09} | after: {'log_recency': -0.71, 'log_frequency': 0.29, 'log_monetary': 0.12}K-means uses Euclidean distance, so (1) scale features or the largest one (monetary) dominates, and (2) log-transform skewed variables so a few big spenders do not form their own clusters.
Choosing k
from sklearn.metrics import silhouette_score, davies_bouldin_score
rows = []
for k in range(2, 9):
    km = KMeans(n_clusters=k, n_init=20, random_state=0).fit(Z)
    rows.append({"k": k, "inertia": round(km.inertia_, 1), "silhouette": round(silhouette_score(Z, km.labels_), 3), "davies_bouldin": round(davies_bouldin_score(Z, km.labels_), 3)})
kt = pd.DataFrame(rows); print(kt.to_string(index=False))k inertia silhouette davies_bouldin 2 681.7 0.460 0.813 3 495.8 0.390 0.889 4 394.6 0.375 0.907 5 300.4 0.386 0.832 6 249.1 0.390 0.838 7 220.2 0.374 0.865 8 192.1 0.372 0.853
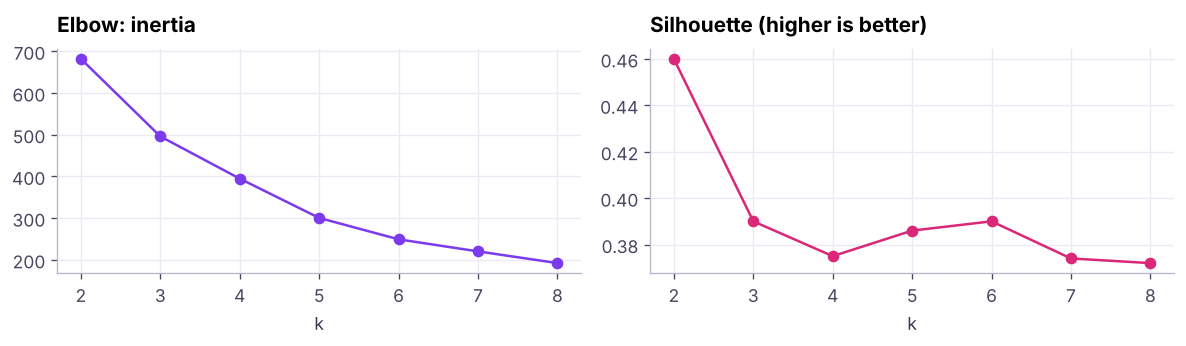
- Elbow method: inertia always falls as k grows; look for the bend where extra clusters stop helping much.
- Silhouette score (−1 to 1): how close each point is to its own cluster compared with the next one; higher is better.
- Davies-Bouldin (lower is better).
- Business sense: the number of segments the team can actually act on (often 3–6).
Here the silhouette is highest at k = 2 (it simply splits active from lapsed customers), with no clear elbow afterwards. We choose k = 4: the scores are close, and four groups give the marketing team more useful distinctions. Statistics guide the choice; the business decides.
Fit and profile
k = 4
km = KMeans(n_clusters=k, n_init=20, random_state=0).fit(Z)
rfm["cluster"] = km.labels_
prof = rfm.groupby("cluster").agg(customers=("R", "size"), recency=("recency", "median"), frequency=("frequency", "median"), monetary=("monetary", "median"), revenue=("monetary", "sum"))
prof["revenue_%"] = (100 * prof.revenue / prof.revenue.sum()).round(1)
prof = prof.sort_values("monetary", ascending=False); print(prof.drop(columns="revenue"))customers recency frequency monetary revenue_% cluster 2 117 68.0 20.0 32923.0 69.3 0 164 165.5 8.0 6643.0 21.2 3 79 84.0 4.0 2836.0 4.5 1 140 406.0 2.0 1880.5 5.0
order = prof.index.tolist()
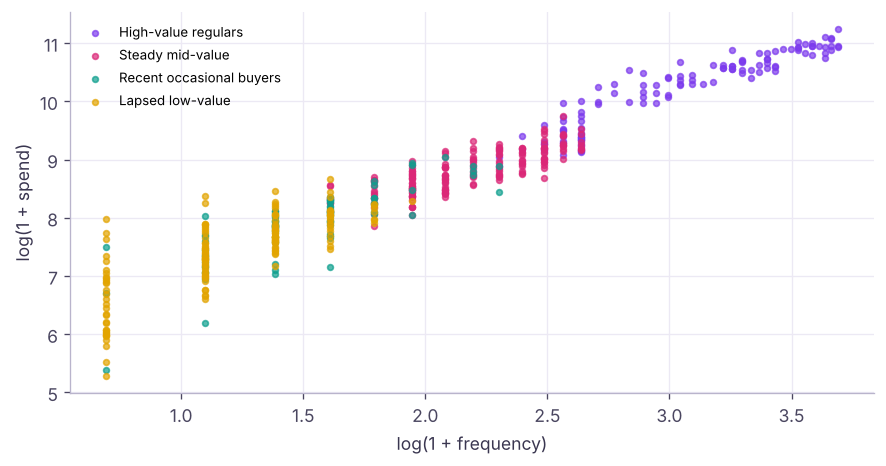
names = dict(zip(order, ["High-value regulars", "Steady mid-value", "Recent occasional buyers", "Lapsed low-value"]))
rfm["cluster_name"] = rfm.cluster.map(names)
print(pd.crosstab(rfm.cluster_name, rfm.segment))segment At risk (were loyal) Champions Hibernating / lost Loyal Need attention New / promising cluster_name High-value regulars 1 101 0 15 0 0 Lapsed low-value 0 0 125 0 15 0 Recent occasional buyers 0 4 0 14 16 45 Steady mid-value 13 30 3 64 54 0
Name clusters from their profiles (median recency, frequency, spend), not from the cluster number. The cross-tab shows how the data-driven clusters line up with the rule-based RFM segments.
K-means assumptions and limits
| K-means assumes / needs | If not | Alternative |
|---|---|---|
| Roughly spherical, similar-size clusters | Elongated or uneven clusters split badly | Gaussian mixtures, DBSCAN (next lesson) |
| Numeric, scaled features | Categories distort distances | K-prototypes, Gower distance |
| k chosen in advance | Silhouette, business needs, hierarchical dendrogram | |
| Sensitive to outliers and initialisation | Log/robust scaling, n_init, k-means++ (default) |
From segments to action
- Write a one-line profile and a goal for each segment (e.g. "At risk: bought often, silent for 4+ months → win back").
- Design an offer or message per segment.
- Test it: randomly hold out part of each segment as control (lesson 6) and measure incremental revenue.
- Refresh the segmentation monthly and track how customers move between segments.
Summary
- RFM turns transactions into recency, frequency and monetary value; quintile scores and rules give transparent named segments.
- K-means assigns points to the nearest of k centroids, minimising inertia; log-transform skewed variables and scale features first.
- Choose k with the elbow, silhouette and Davies-Bouldin scores plus business sense; profile and name clusters by their medians.
- K-means prefers spherical clusters and numeric data; use other methods for odd shapes or categorical data.
- Segments are only valuable when they drive tested actions.
1. What does "recency" measure in RFM?
2. Why scale features before K-means?
3. What does inertia measure?
4. A silhouette score near 0 means…
5. A segment "bought often but not for 5 months" is best called…
6. How should you name clusters?
(1) Add avg_order_value and tenure_days (days since first purchase) to the features and re-cluster: does the silhouette improve? (2) Compare K-means with k = 3 and k = 5 profiles: which is more actionable? (3) Compute RFM on the Superstore data for 2025 and list the top 10 Champions.
Show solution
first = tx.groupby("customer_id").invoice_date.min()
f2 = feat.assign(log_aov=np.log1p(rfm.monetary / rfm.frequency), log_tenure=np.log1p((snapshot - first).dt.days))
Z2 = StandardScaler().fit_transform(f2)
for k in (3, 4, 5): print(k, silhouette_score(Z2, KMeans(k, n_init=20, random_state=0).fit_predict(Z2)))
s = pd.read_csv("superstore_sales.csv", parse_dates=["order_date"]); s = s[s.order_date.dt.year == 2025]
snap = s.order_date.max() + pd.Timedelta(days=1)
r2 = s.groupby("customer_id").agg(recency=("order_date", lambda d: (snap - d.max()).days), frequency=("order_id", "nunique"), monetary=("sales", "sum"))
r2["score"] = pd.qcut(-r2.recency, 5, labels=False) + pd.qcut(r2.frequency.rank(method="first"), 5, labels=False) + pd.qcut(r2.monetary, 5, labels=False)
print(r2.sort_values(["score", "monetary"], ascending=False).head(10))Q: How do you choose the number of clusters? Elbow plot of inertia, silhouette and Davies-Bouldin scores, stability across random seeds, and above all whether the segments are distinct and actionable.
Q: What are the limitations of K-means? k must be chosen; it assumes spherical, similar-sized clusters; it is sensitive to scaling, outliers and initialisation; it handles only numeric distances.
Q: Explain RFM segmentation. Score customers on recency, frequency and monetary value (usually by quintiles), combine the scores, and map combinations to named segments with tailored actions.
Practise more online
Free, trusted places to test yourself on this topic. Links open the original site in a new tab.